There are many well-known libraries and platforms for data analysis such as Pandas and Tableau, in addition to analytical databases like ClickHouse, MariaDB, Apache Druid, Apache Pinot, Google BigQuery, Amazon RedShift, etc. While machine learning frameworks and platforms like PyTorch, TensorFlow, and scikit-learn can perform data exploration well, it’s not their primary intent. There are also plenty of data visualization libraries available that can handle exploration like Plotly, matplotlib, D3, Apache ECharts, Bokeh, etc.
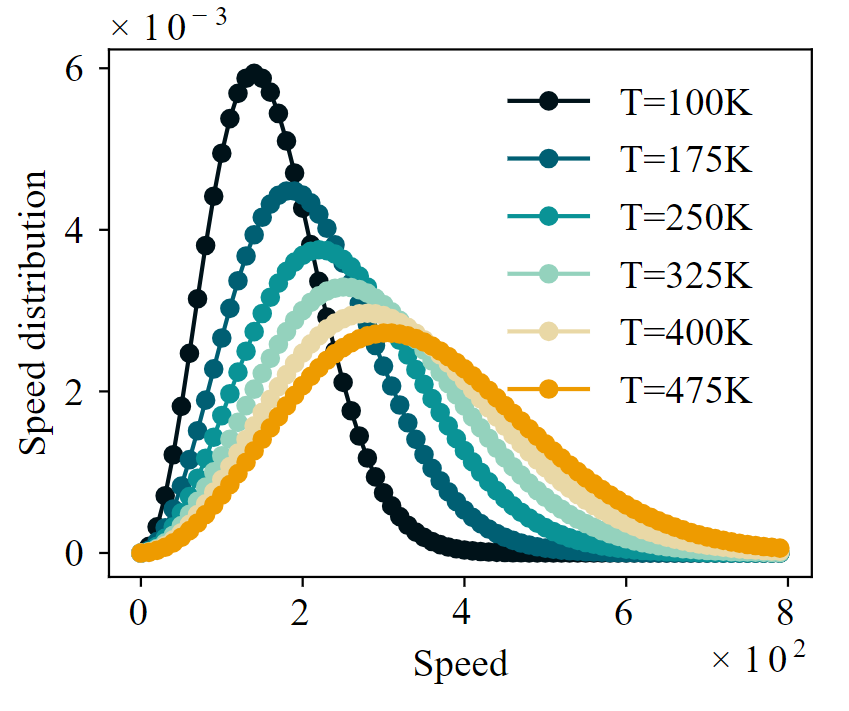
LovelyPlots is a repository containing matplotlib style sheets to nicely format figures for scientific papers, thesis and presentations while keeping them fully editable in Adobe Illustrator. Additonaly, .svg exports options allows figures to automatically adapt their font to your document’s font. For example, .svg figures imported in a .tex file will automatically be generated with the text font used in your .tex file.
Link
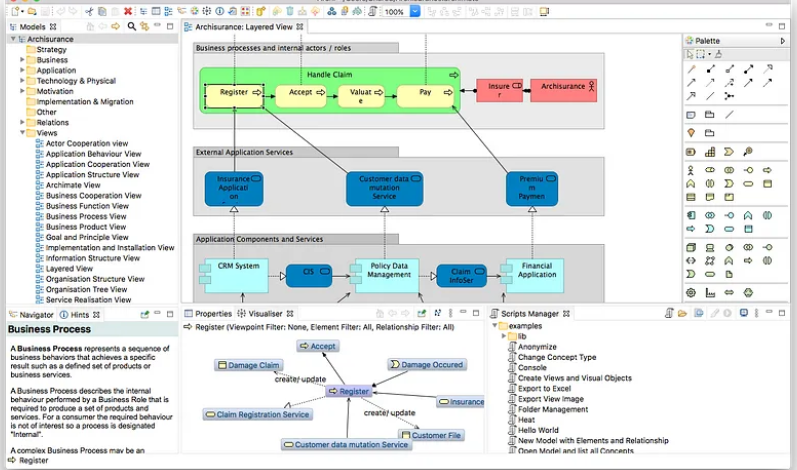
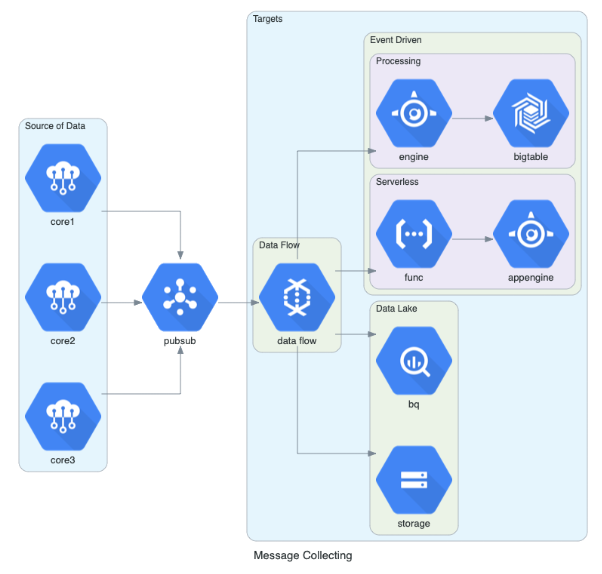
Diagrams lets you draw the cloud system architecture in Python code.
It was born for prototyping a new system architecture without any design tools. You can also describe or visualize the existing system architecture as well.
Diagram as Code allows you to track the architecture diagram changes in any version control system.
Link